888-746-8227 Support
Generic selectors
Exact matches only
Search in title
Search in content
Post Type Selectors
Back

Time Tracking Dashboard for Executives

Keep a finger on the pulse of your business. 

A career in management is difficult; good software should make it easier. With ClickTime, your managers can quickly access workforce and project data. Our time tracking & executive dashboards show you relevant information in an easily digestible format. It’s a surefire way to keep yourself apprised of your business’ current events.

time tracking dashboard

Some Of Our Dashboard Favorites

  • Billable Hours Summary: Quickly view how billable your business, team, or employee has been during the past month. 
  • Hours Worked in Last 7 Days: See what projects your organization has been working on recently and how many hours they’ve spent on each one.
  • Budgets to Watch: See progress made against monthly budgets. View remaining budgets, as well as any overages that may have occurred. 
  • Projects to Watch: View how many hours have been worked on each project. Track actual hours worked against your initial estimates.

Analyze Your Project Portfolio

Some of your clients are going to be more profitable than others. And some types of projects will be as well. With ClickTime, you’ll have a portfolio-level view of your initiatives to easily analyze costs, billings, and profit margins. This way, you’ll spot trends and outliers amongst your projects, allowing you to double down on the work that makes your firm most profitable.

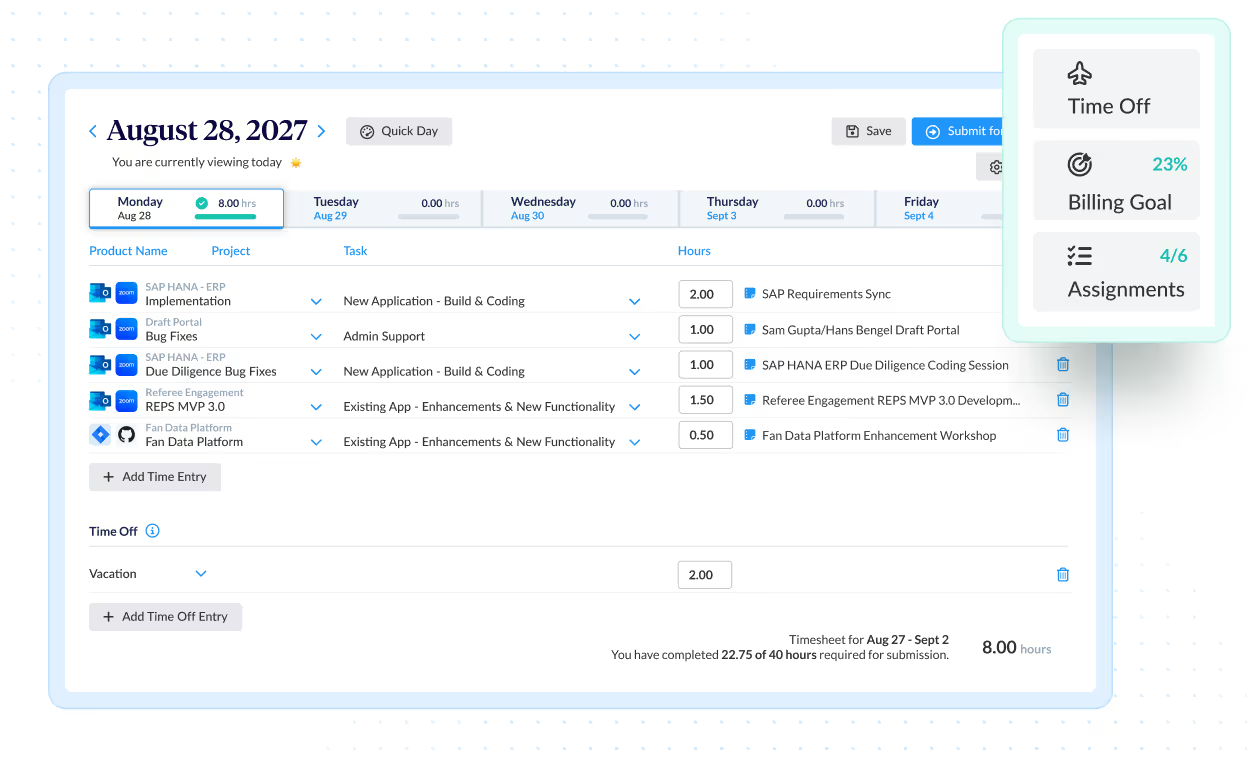
View Your Team’s Time Tracking Habits

When time tracking data or timesheets are uploaded late, the quality of your data suffers. After all, very few people can remember what they did during every hour of the past week. With ClickTime’s Time Entry Completion dashboard, you’ll be able to:

  • Monitor employees’ daily timesheet completion.
  • Send time entry reminder emails from ClickTime.
  • Correct poor timesheet practices before they become habits.

Create Any Report Imaginable

ClickTime’s built-in Business Intelligence tool allows you to analyze your data in any way imaginable. Complete with formulas, thresholds, conditional formatting, and custom fields, you’ll uncover the insights most organizations miss.

  • Visualize Your Project & Time Data: Add bar graphs, scatterplots, line graphs, and other charts to your reports to make them more easily digestible. 
  • Schedule Reports to Your Inbox: After creating custom reports, you can send them to your email inbox on a pre-specified cadence. 
  • Tap Our Professionals for Help: If your organization needs training or assistance to best utilize our top-tier BI Tool, our experts are on-hand to assist.

Better Data & Better Dashboards Your Team Will Love

We’re obsessed with making it easy for managers and executives to see the full picture. Whether you prefer bar graphs or line charts— we’ve got you covered with dashboards that make your life easier!