Quarterly comparisons with Report Builder
Table of Contents
Are you interested in comparing your time worked on projects from one quarter to another? Or perhaps comparing your company's billable totals for one or more clients from one quarter to the next. Here's a quick example of how to do quarterly comparisons using Report Builder.
1) In the Company tab, click on the Reports option and then click to run Report Builder.
2) Select the date range you want to report on, and click the "update" button.


Year([Entry Date]) & " " & IIF(Month([Entry Date]) <= 3,"Q1", IIF(Month([Entry Date]) >= 10,"Q4", IIF((Month([Entry Date]) >= 7 And Month([Entry Date]) <= 9),"Q3","Q2") ) )
Click the "Add" button and the new "Quarter" column will appear in your report.
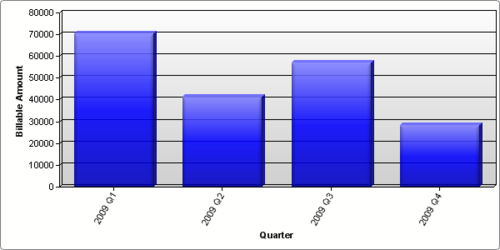
Now you're ready to create any chart or graph to compare your data across quarters. Click the chart icon and select from pie charts, bar graphs or other charting options to visualize quarter-to-quarter comparisons.

Don't forget to click the "Save As" button so that you can easily review this report again later.


