New Reporting Tools
Table of Contents
As the product manager for ClickTime, I’ve enjoyed the opportunity to speak with many of our customers regarding how you track time, what you want to accomplish and what new features and functionality you want to see added to our time and expense tracking service. The most frequent requests have to do with reporting and the desire to breakdown and evaluate your data in unique ways.

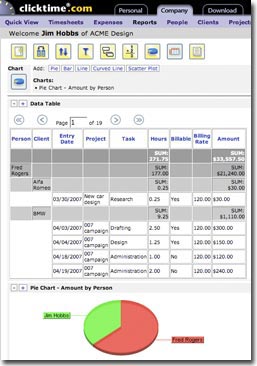
Filtering Data with Report Builder: The Report Builder provides you with the ability to create multiple filters for reporting on your data. For example, you may only want to see how much time 5 specific people have worked on 3 jobs during the first quarter of the year. Filtering is possible with other reports but combining multiple different filters for people, clients, jobs and tasks at the same time often required that you export the data to Excel.
To try out the Report Builder:
- Go to the Reports section under the Company tab.
- Click the “Run Report Builder” link.
- Click the filter icon (it looks like a funnel) to show the options.
- Select the column to filter on and specify the options you want (e.g. clients that start with the letter “c”).
- Click the “Add” link.
The report will refresh showing the filtered data and you can proceed with adding additional filters.
After you’re done applying some filters, try the other options (sorting, add/remove columns, create your own calculated formula column, etc.) and you’ll quickly realize the flexibility and power you now have for analyzing your time entries.
If you have any questions or suggestions regarding Report Builder or any other feature, please let us know.


